Challenge
Market data came from different sources, frequencies and levels of detail, and was reconciled manually each cycle.

Market data prepared with one button, so the team can focus on analysis.
An automated pipeline pulls market data from each source, applies internal categories through Master Data Services and delivers a prepared dataset to Power BI.
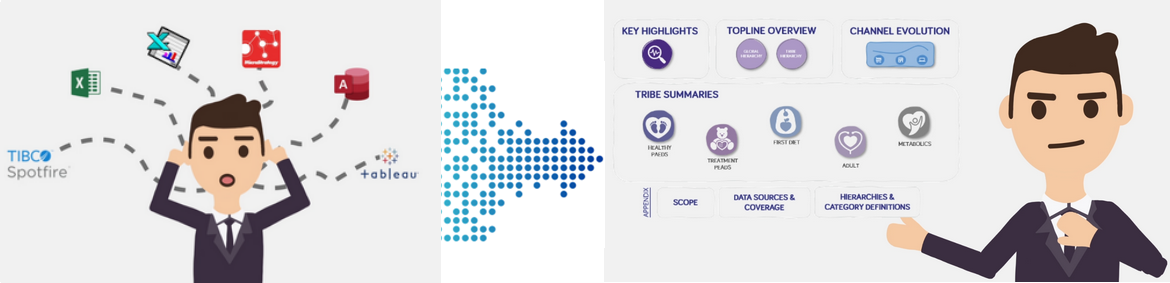
Challenge
Market data came from different sources, frequencies and levels of detail, and was reconciled manually each cycle.
Delivered
An algorithm and automated pipeline with a Master Data Service layer for user enrichment.
Enabled
The Marketing and Innovation team works with a prepared dataset in Power BI.
Nutricia's Marketing and Innovation Department employees constantly analyze the market and the company's place in it - looking for niches for new products and opportunities to expand the presence of existing ones. Market data, however, came from different sources with different frequencies and levels of detail. Each cycle, employees spent significant time collecting and reconciling data manually before they could even start analyzing it. The team needed an analytical platform that takes the routine data-prep work off their plate.
We developed an algorithm and automated pipeline that lets users download and process all the required data "with one button". The pipeline pulls market data from each source on its own cadence, normalizes structures and granularities, and lands the data in a staging layer.
From staging, the data flows into a Master Data Service layer where users can enrich product and market-participant master data with internal categories and values used by the company. Once the user has finished enriching, the dataflow continues automatically to the final storage and on to Power BI - where the marketing and innovation team works with the prepared dataset.
Users download and process all required data "with one button"; the pipeline pulls each source on its own cadence into staging.
In the Master Data Service layer, users enrich product and market-participant master data with internal categories.
The dataflow continues automatically to final storage and on to Power BI.
Illustration from the case.
Qualitative project outcomes; no measured savings are claimed.
Marketing and Innovation team focuses on market analysis, not data preparation
"One-button" data refresh replacing multi-source manual collection
Internal product and market-participant categories applied consistently via MDS
Faster identification of niches for new products and growth opportunities for existing ones
Foundation for repeatable market share reporting across cycles
Solution areas: Data Foundations · Data Products

Choose a 30-minute conversation or send us a short enquiry - whichever works for you.