Challenge
Different source codes, time grains and trade terms prevented a consistent view of margin across countries.

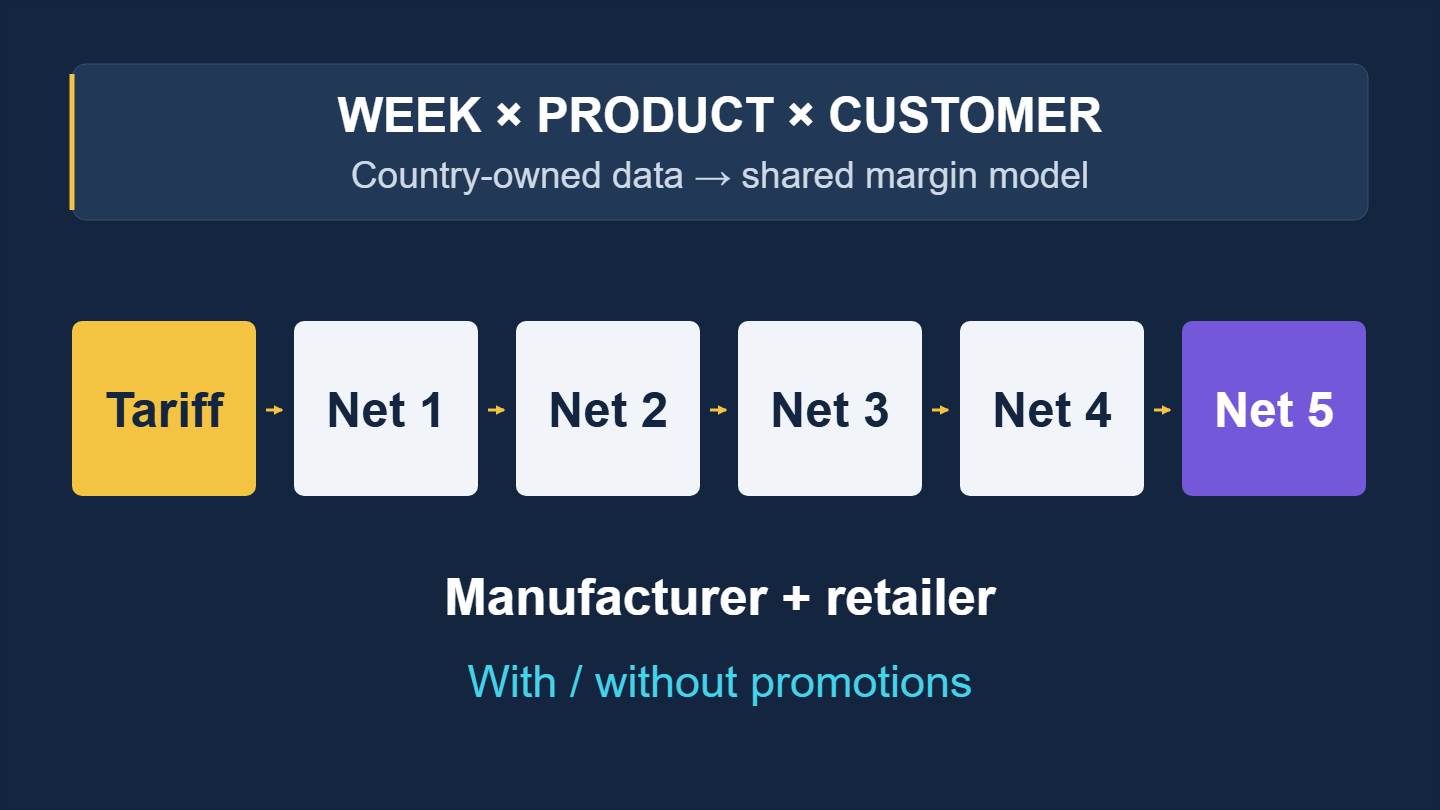
A weekly price waterfall from tariff to net-net, with manufacturer and retailer margin views, built on country-owned data and a common reporting model.
Challenge
Different source codes, time grains and trade terms prevented a consistent view of margin across countries.
Delivered solution
Country-owned weekly data, an incremental Parquet contract, a shared net-price engine and generated Power BI measures.
Business value
Comparable weekly price waterfalls and margin views, with local data ownership and further countries onboarding.
A food and beverage manufacturer wanted one view of how its prices move from the list tariff to the final net price. The view needed to show every trade condition along the way, what shoppers actually pay on the shelf, and how the margin splits between manufacturer and retailer. It had to work per product, per customer and per week, for several European countries, and also as a European total.
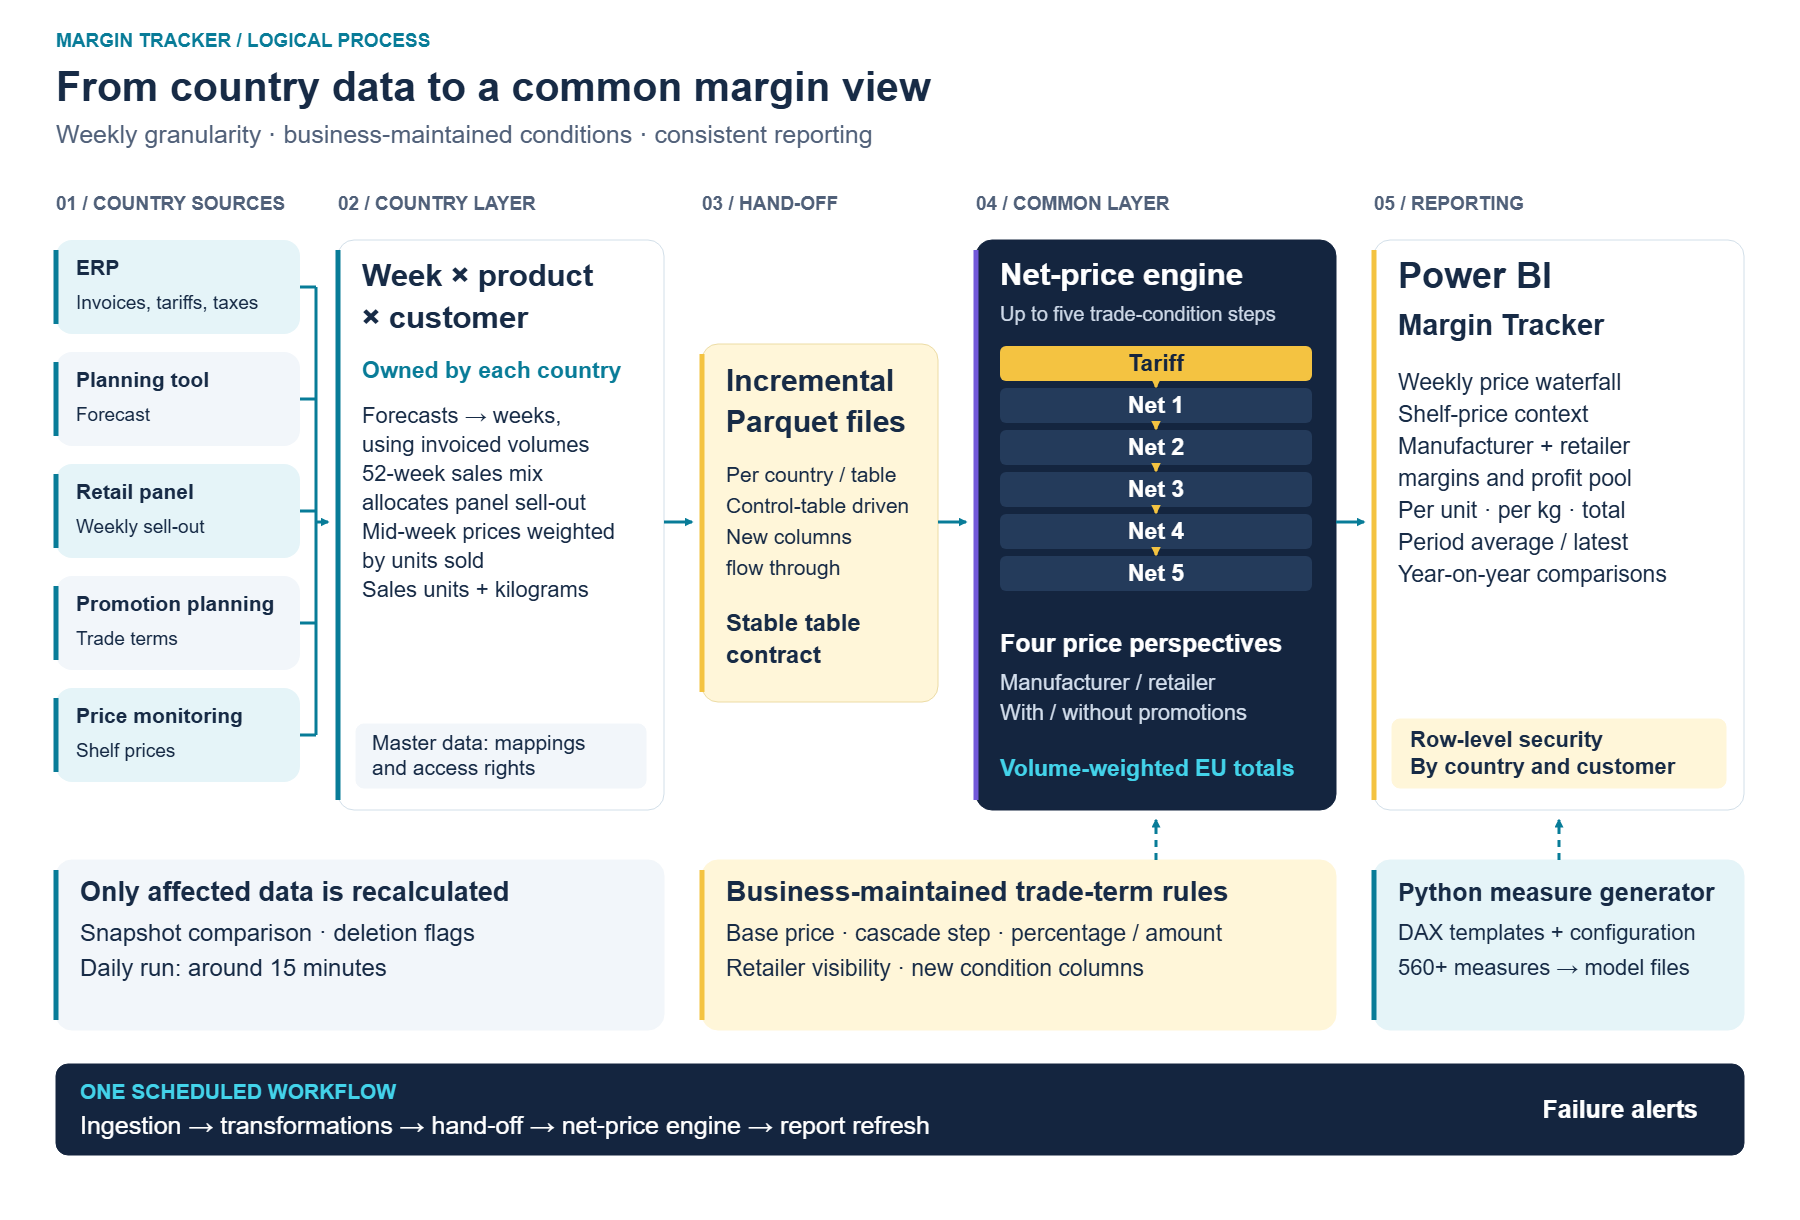
The data sat in many places, and each country got it from different systems and providers. The ERP held invoices, tariffs and taxes. A planning tool held the forecast. A retail panel provided weekly sell-out, a promotion-planning tool held the trade terms, and a monitoring service tracked shelf prices. Every source had its own codes and its own granularity: daily invoices, monthly forecasts, panel weeks that don't line up with calendar weeks, and promotions agreed with a buying group rather than with each store.
The hardest part was the discount logic. Trade conditions apply in a cascade of up to five steps. Each one is a percentage or a fixed amount, and is applied to a specific intermediate price. Some are promotional, and some are visible to the retailer and some are not. A single country had a previous version of the tracker. Scaling it to more countries meant the logic could no longer be hard-coded. On top of that, the countries ran on different generations of the data platform and needed to migrate at their own pace.
We split the solution into two layers with a clear contract between them.
Country sources are aligned to week, product and customer, including forecast allocation, a rolling 52-week sales mix, weighted price changes and unit conversions. Incremental Parquet exports pass through a stable table contract into a common net-price engine. Business-maintained rules drive up to five trade-condition steps and four price perspectives. European totals use volume-weighted averages. Python generates more than 560 Power BI measures from DAX templates and configuration. A scheduled workflow runs the pipeline and report refresh in dependency order, with failure alerts.
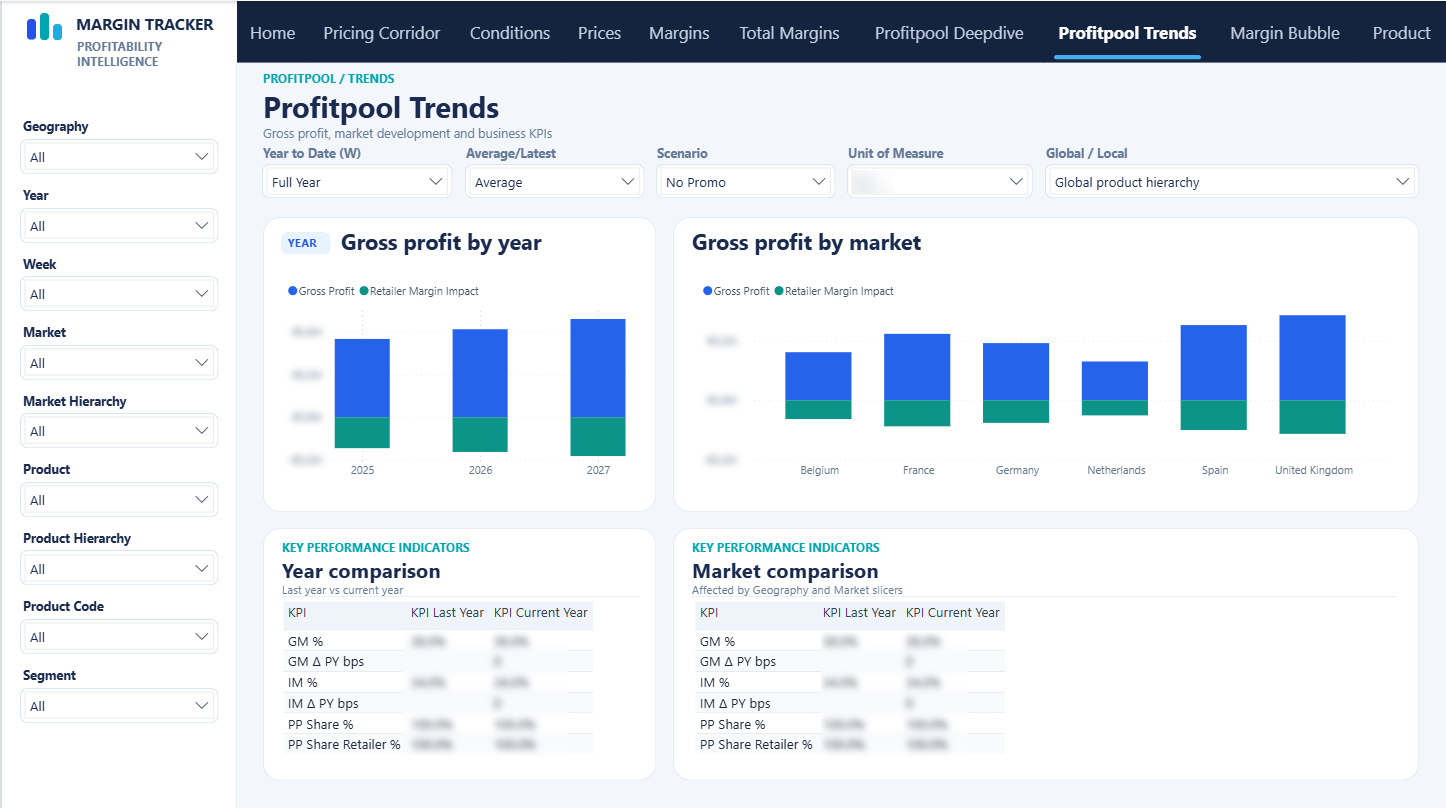
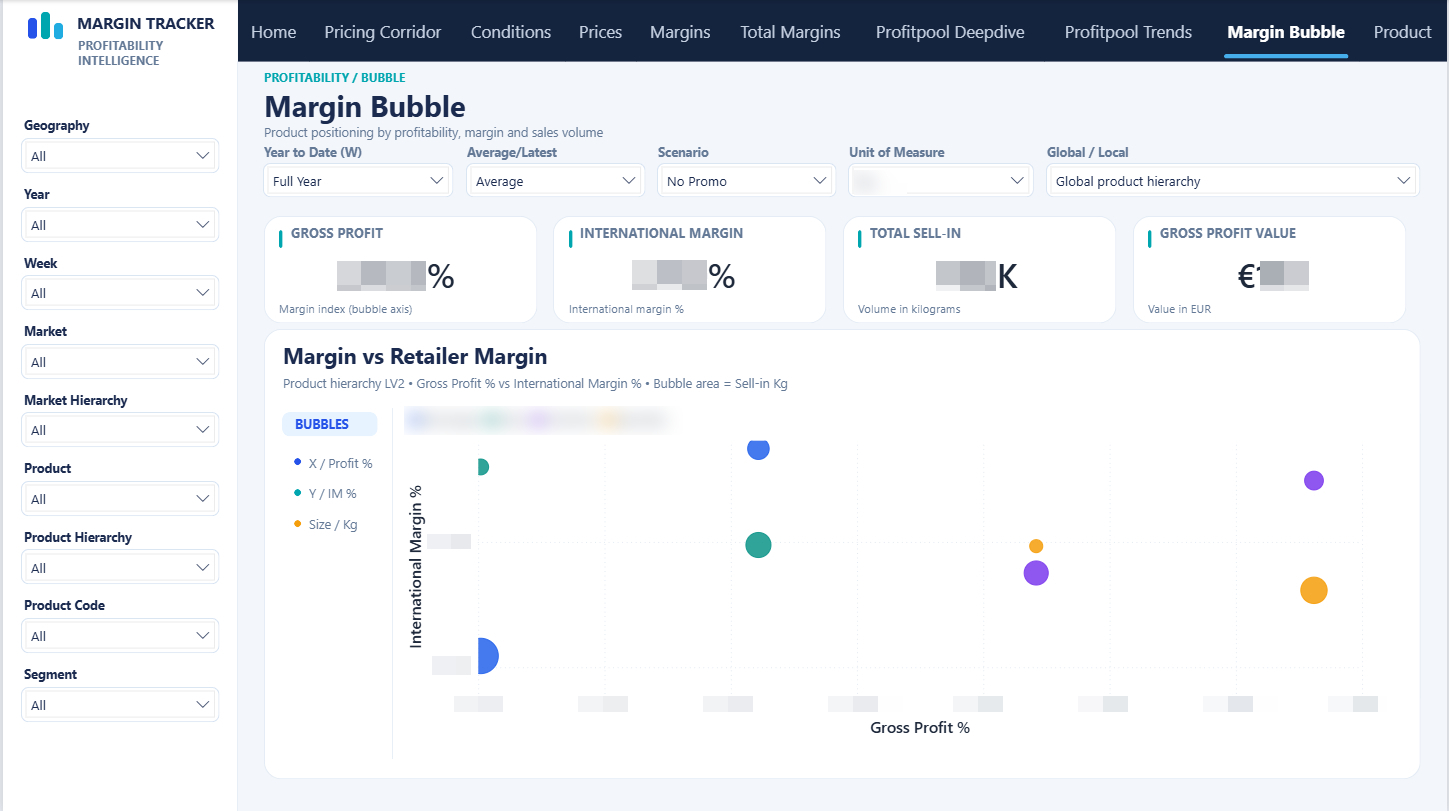
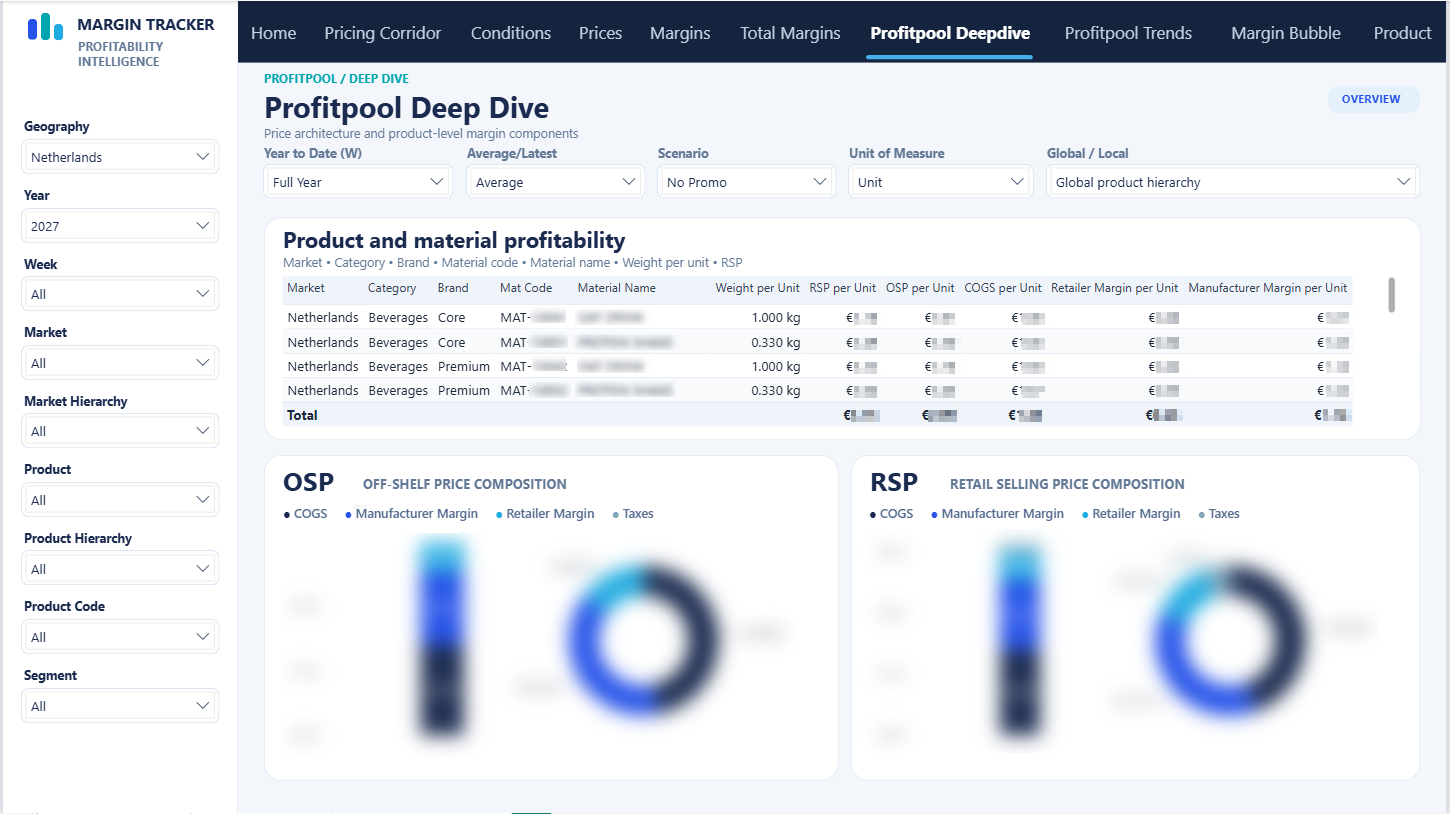
Three pages from the Power BI report. Figures and material names are blurred for confidentiality.
Report page · 01 / 03
Gross profit and retailer margin impact by year and by market, with KPI comparisons of last year against the current year.
Report page · 02 / 03
Products positioned by gross profit % against international margin %, with bubble area showing sell-in volume in kilograms.
Report page · 03 / 03
Price architecture per product and material: retail selling price, off-shelf price, cost of goods sold, and retailer and manufacturer margin per unit.
Qualitative project outcomes; no measured savings are claimed.
One weekly price waterfall per product and customer, from tariff to net-net and on to the shelf price
Manufacturer and retailer margins side by side, with profit pool and share, including year-on-year comparisons
The same model and the same definitions for every country, plus European totals
Trade-term logic in business-maintained rules instead of hard-coded formulas; new condition types appear as new columns automatically
Hundreds of consistent measures generated from one configuration, instead of hand-written formulas that drift apart
Fast daily refreshes, because only what changed is recalculated
Countries keep ownership of their local data and can migrate platforms at their own pace, behind one stable table contract
Live for the first country, with further countries onboarding on the same contract
Solution areas: Data Foundations · Analytics & Reporting

Choose a 30-minute conversation or send us a short enquiry - whichever works for you.