Challenge
Turn changing process signals into a clear view of degradation, failure risk and the right maintenance window.

A client pilot connecting sensor patterns, degradation forecasts and maintenance priorities, with uncertainty and model health visible alongside the equipment.
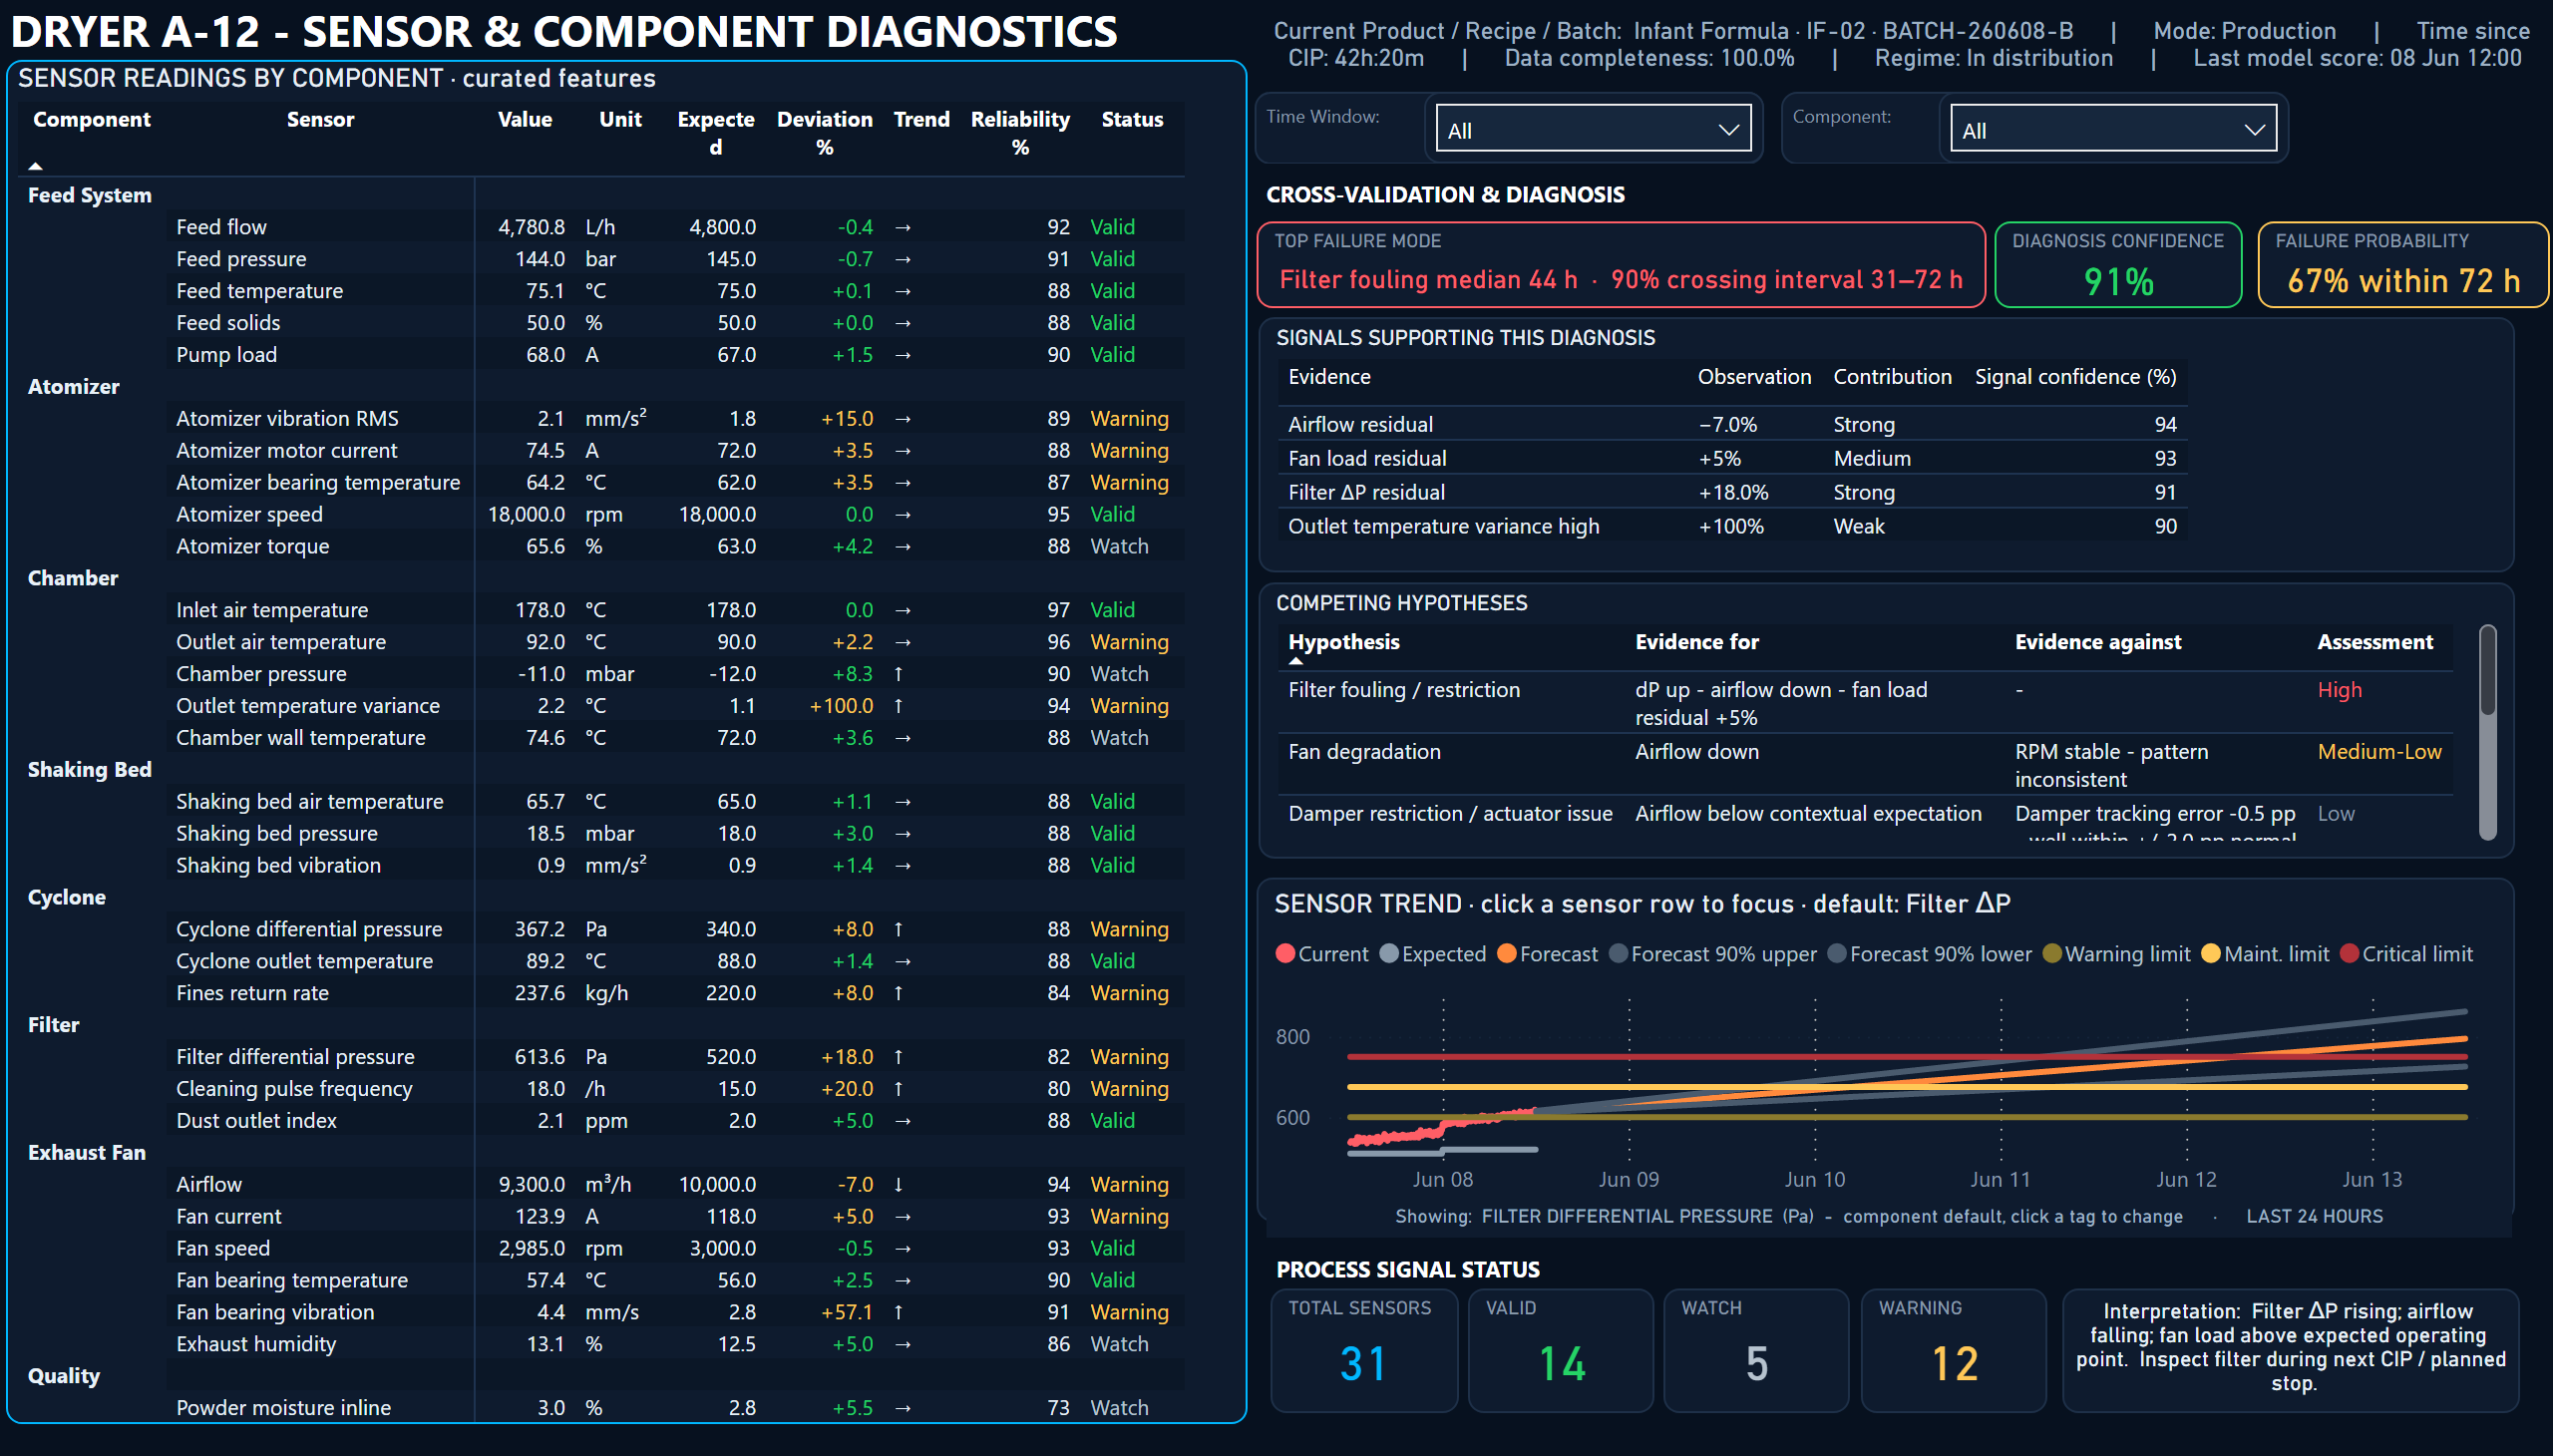
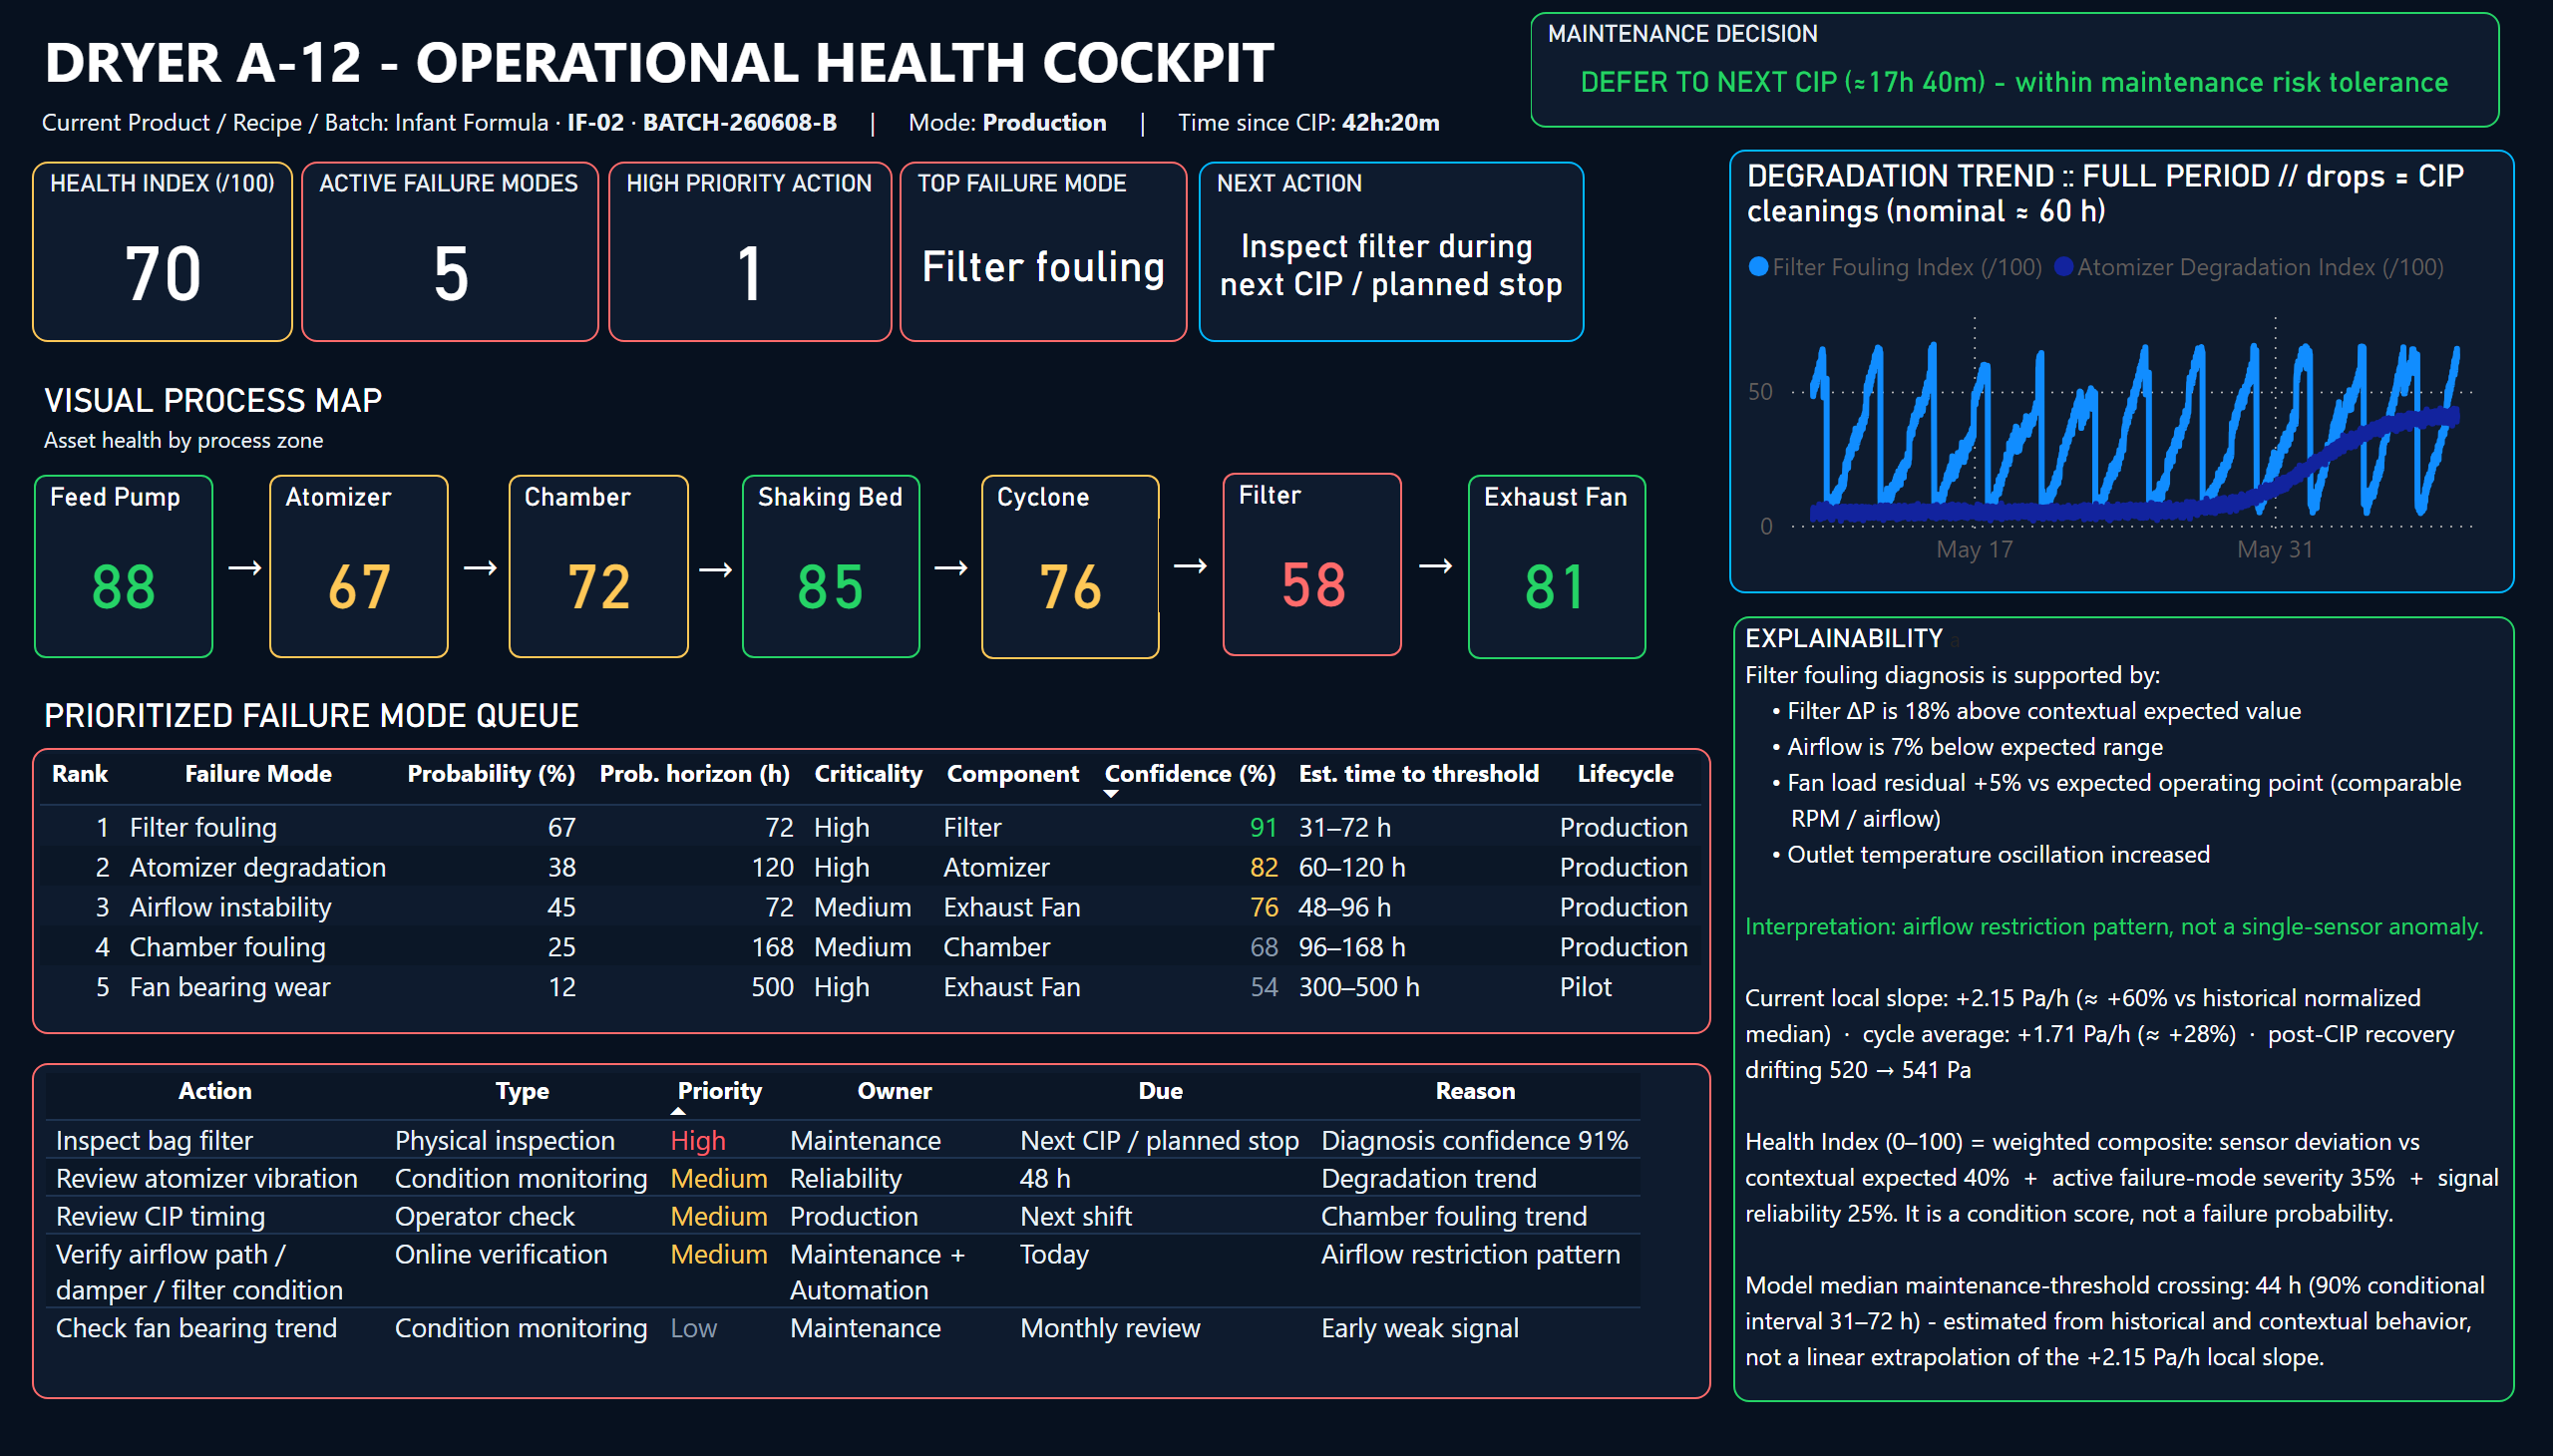 Dryer cockpitA process overview connects component condition, active failure modes and maintenance priorities. Forecast windows and planned cleaning opportunities support the next operational decision.
Challenge
Turn changing process signals into a clear view of degradation, failure risk and the right maintenance window.
Pilot solution
Connect equipment diagnostics, forecasts and maintenance planning in one operational interface, with model and data monitoring.
Decision supported
Help reliability and operations teams judge what to inspect, how urgently to act and whether work can align with planned cleaning.
Spray-dryer readings vary with recipes, operating modes and cleaning cycles. A single unusual value does not explain whether equipment is deteriorating, what is driving the change or when intervention is needed.
The maintenance decision also depends on production constraints. Teams need to compare the forecast window with the next cleaning or planned stop, while understanding the uncertainty behind it.
PI is the upstream data source, outside the project scope. The analytical workflow runs through Azure Data Lake Storage (ADLS) into Snowflake, combining SQL feature engineering, Snowpark ML, Tasks and Streamlit, with Power BI for operational reporting.
Contextual expected-value models establish the baseline for operating conditions. Residual rules identify departures from that baseline, while degradation forecasts estimate time to an engineering threshold.
Failure probability, diagnostic confidence and forecast intervals are shown separately. Model and data-health monitoring adds validation, drift and data-quality context; maintenance screens expose work-order references and inspection feedback.
Five report views and a health-index detail from the client-pilot interface. The screenshots use synthetic/demo data; displayed values are not measured client outcomes.
Client pilot · 01 / 06
A process overview connects component condition, active failure modes and maintenance priorities. Forecast windows and planned cleaning opportunities support the next operational decision.
Client pilot · 02 / 06
Sensor readings are compared with expected behaviour in the current operating context. Competing hypotheses, supporting signals and forecast ranges make the reasoning behind an alert visible.
Client pilot · 03 / 06
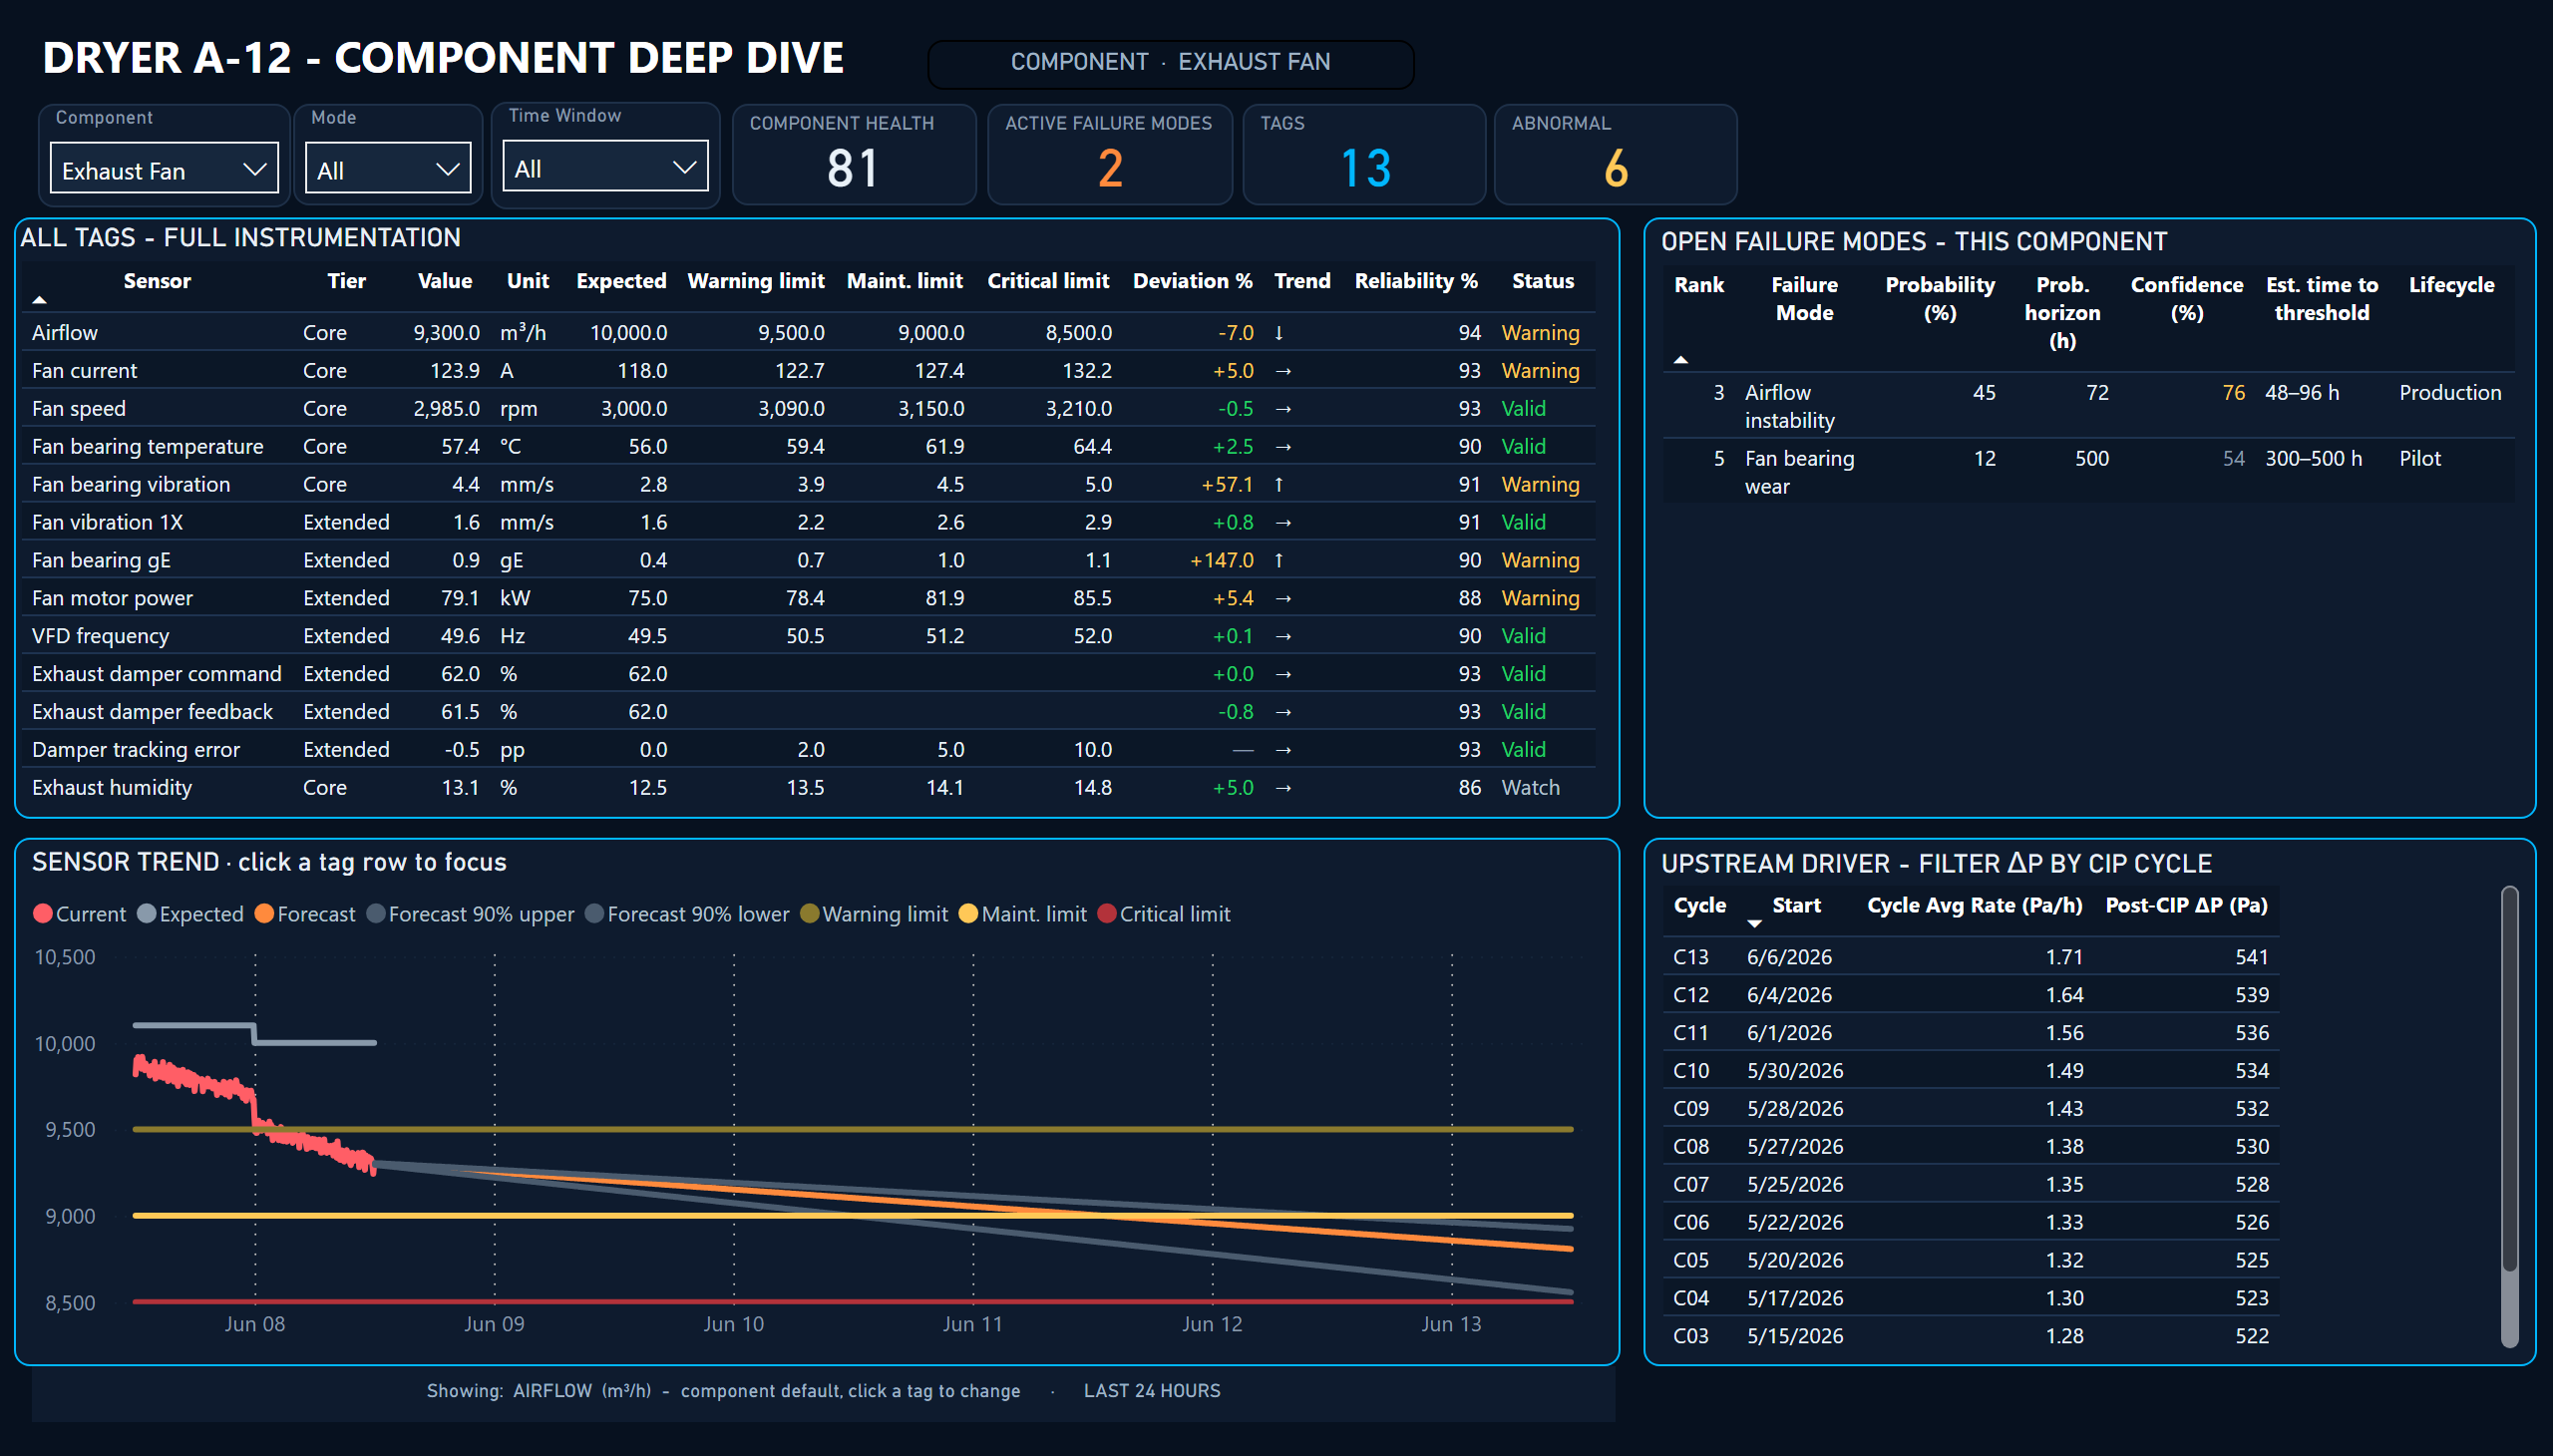
The component view brings instrument readings, abnormal signals and open failure modes together. Trend views help distinguish local equipment behaviour from upstream process effects.
Client pilot · 04 / 06
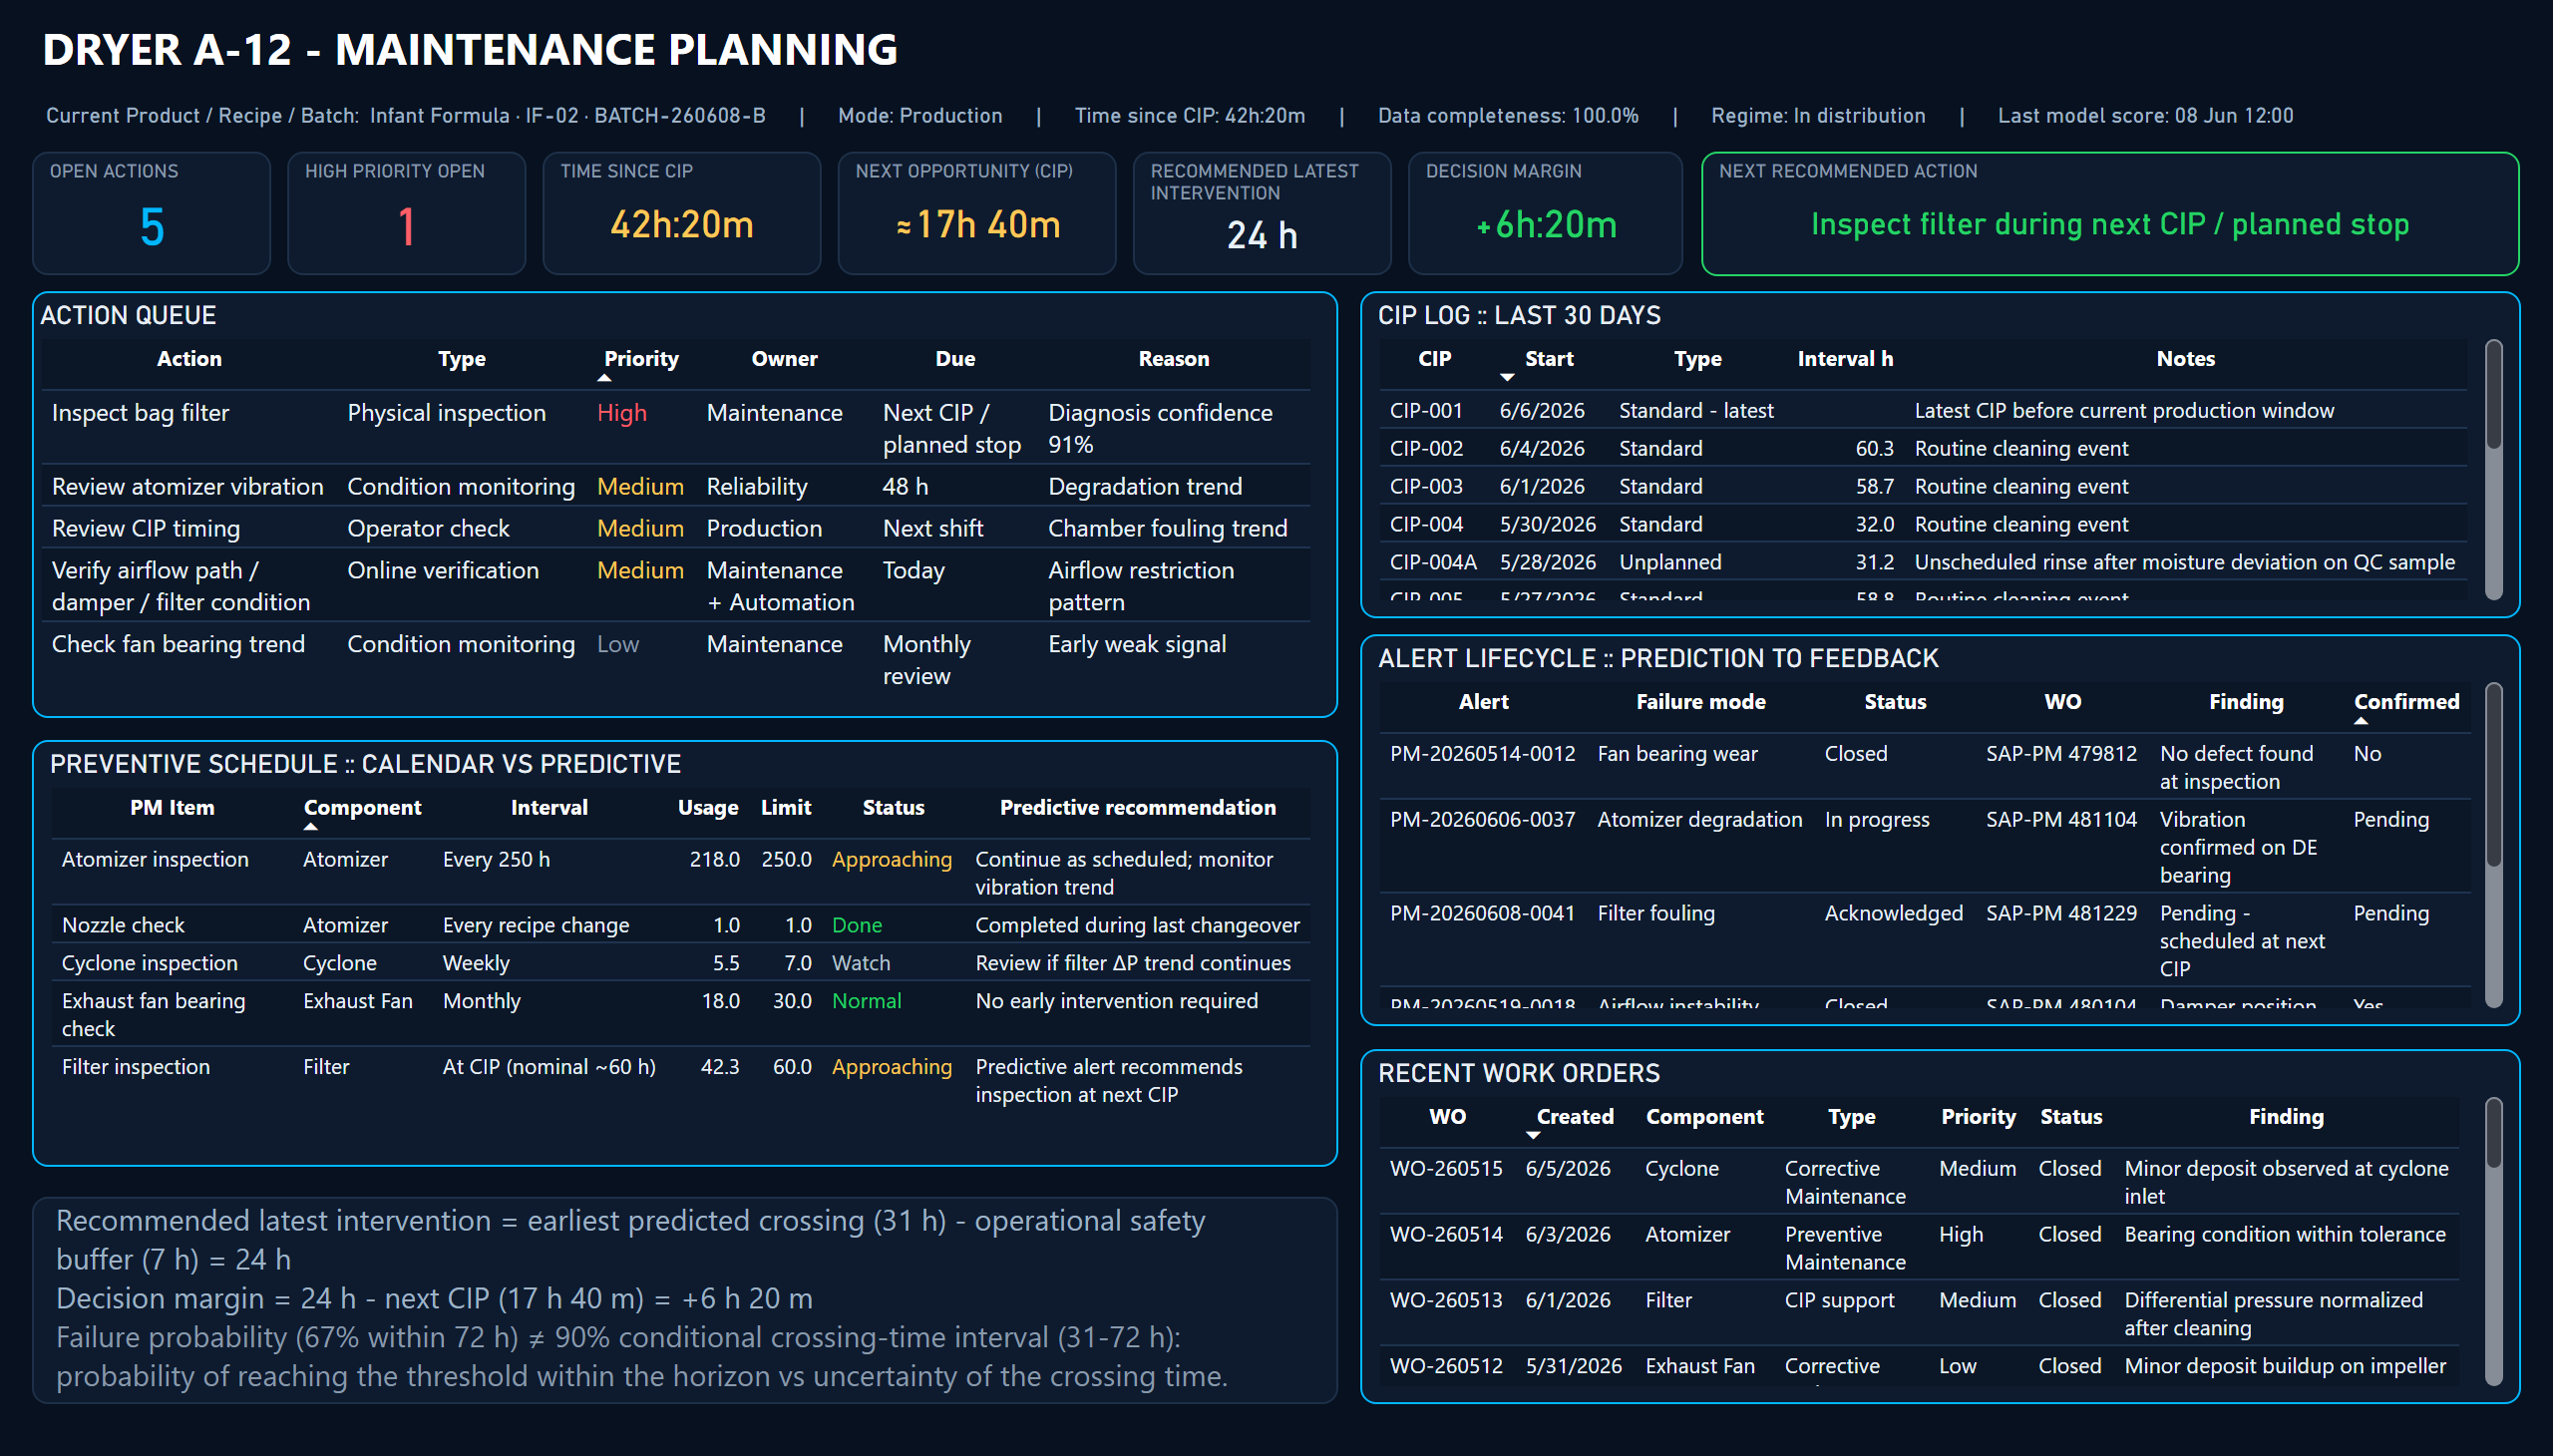
A prioritised action queue sits alongside preventive schedules, cleaning windows and work-order references. Inspection findings and intervention feedback can be reviewed with the original prediction.
Client pilot · 05 / 06
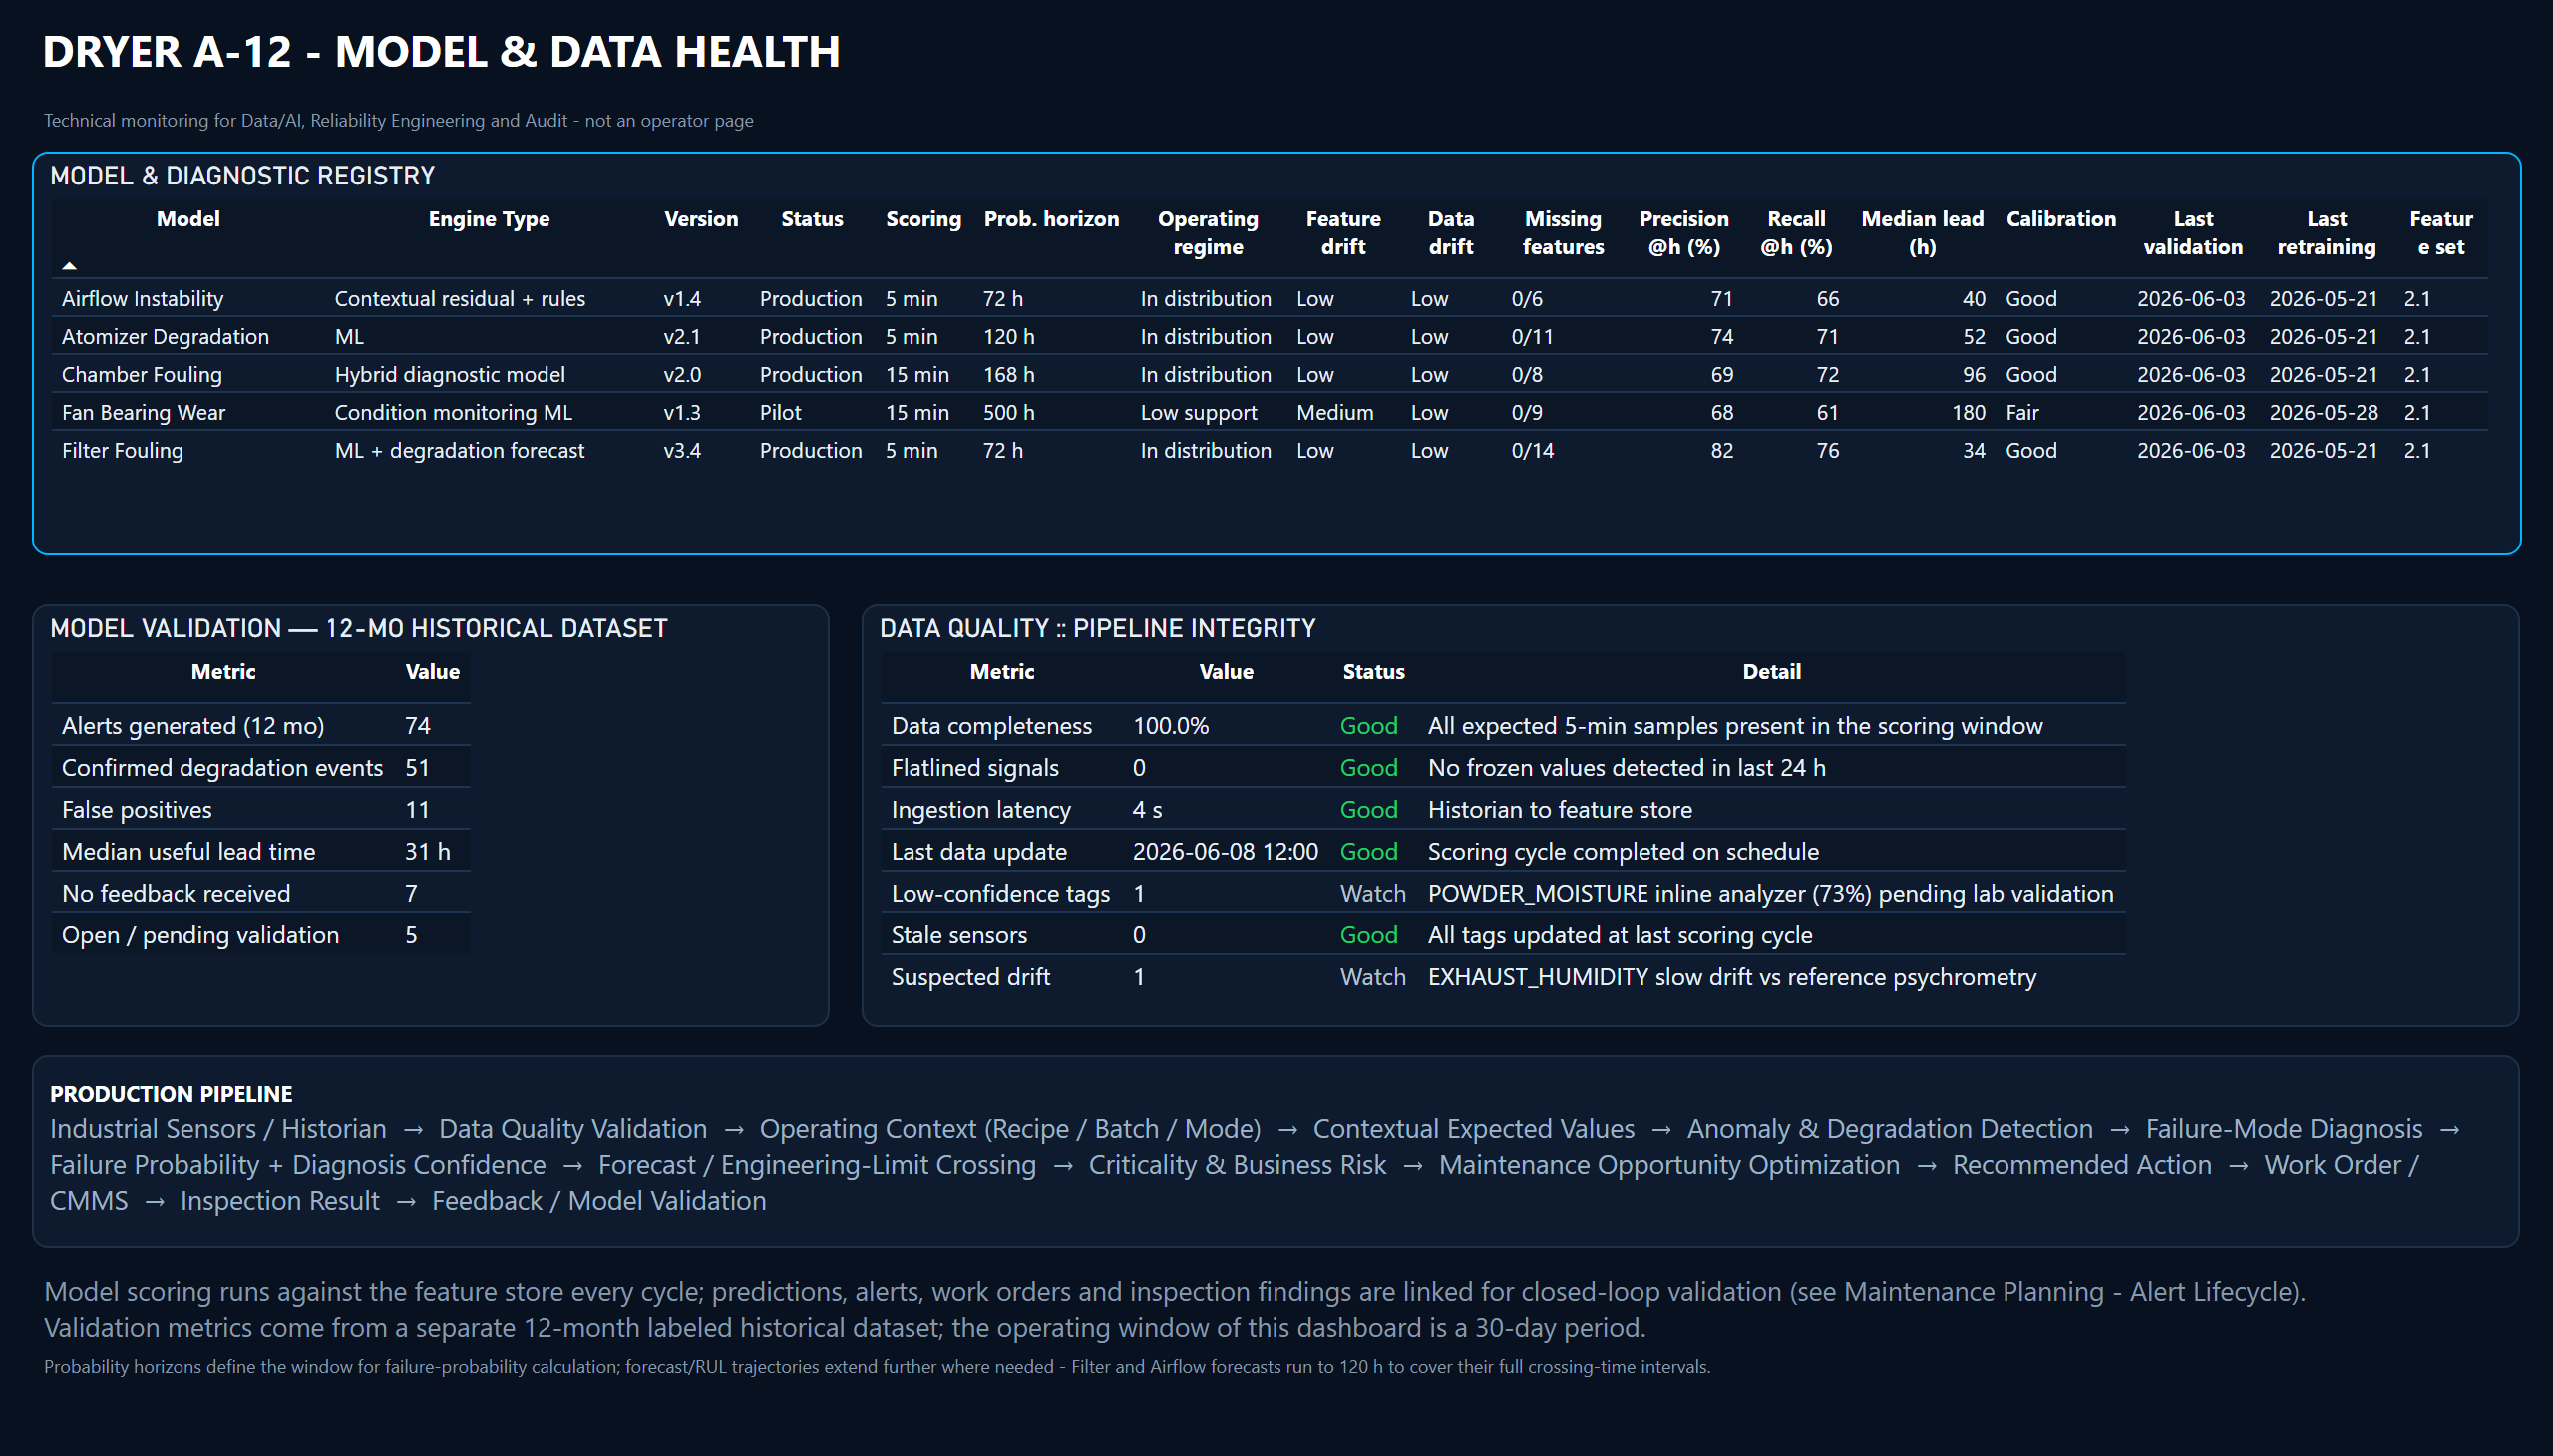
The technical view tracks model versions, validation measures, drift and feature quality. It also shows how sensor inputs, operating context and maintenance feedback connect through the analytical workflow.
Client pilot · 06 / 06
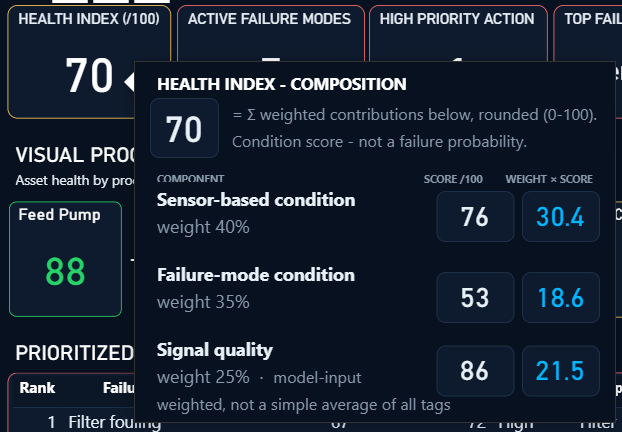
The health-index tooltip explains the weighted contribution of sensor condition, failure-mode severity and signal quality. The resulting condition score is separate from a failure probability.
Trace an equipment alert to sensor evidence, operating context and competing explanations.
Compare degradation forecasts and their uncertainty with practical maintenance opportunities.
Review model quality, data health and inspection feedback alongside the operational decision.
Explore:Data Analytics & ML · Data Products

Choose a 30-minute conversation or send us a short enquiry - whichever works for you.