Challenge
Line issues became visible only after they had affected output; losses were tracked retrospectively in spreadsheets.

Live line health and telemetry from MES, SCADA and PLC signals.
An end-to-end real-time layer with live dashboards, anomaly detection and an AI agent that surfaces the relevant remediation steps when an alert fires.
Challenge
Line issues became visible only after they had affected output; losses were tracked retrospectively in spreadsheets.
Delivered
A real-time intelligence layer from MES, SCADA and PLC signals to live dashboards and AI-ready datasets.
Enabled
Live line health, telemetry, energy and downtime views, with anomaly detection and SOP-aware guidance.
Production lines generated thousands of telemetry signals per second, but operations teams couldn't see issues until after they'd impacted output. Quality losses, downtime, and energy waste were tracked retrospectively in spreadsheets - too late to intervene, too coarse to diagnose root cause. Engineering wanted real-time visibility; IT wanted a sustainable architecture; finance wanted the energy bill down.
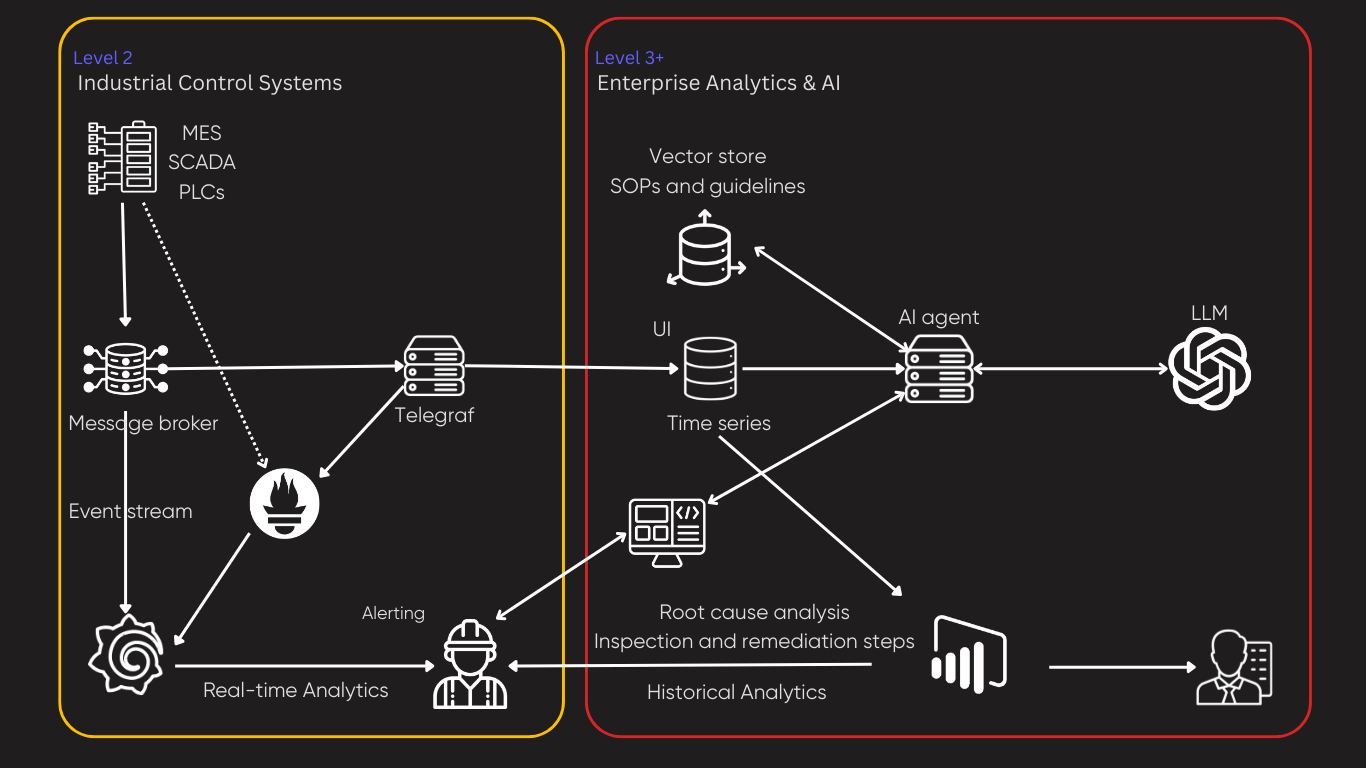
We built an end-to-end real-time intelligence layer connecting MES, SCADA, and PLC signals to an enterprise analytics layer. Edge gateways stream sensor data via a message broker into a time-series database optimized for industrial workloads. On top of that: live dashboards for line health, machine telemetry, energy consumption, and downtime events with structured incident reports.
AI-ready datasets sit alongside the time-series store, feeding intelligent models that detect anomalies before they cause failures. A vector store of SOPs and operational guidelines connects to an AI agent - so when an alert fires, the system also surfaces the relevant remediation steps.
Line health and machine telemetry dashboards.
Dashboard view · 01 / 02
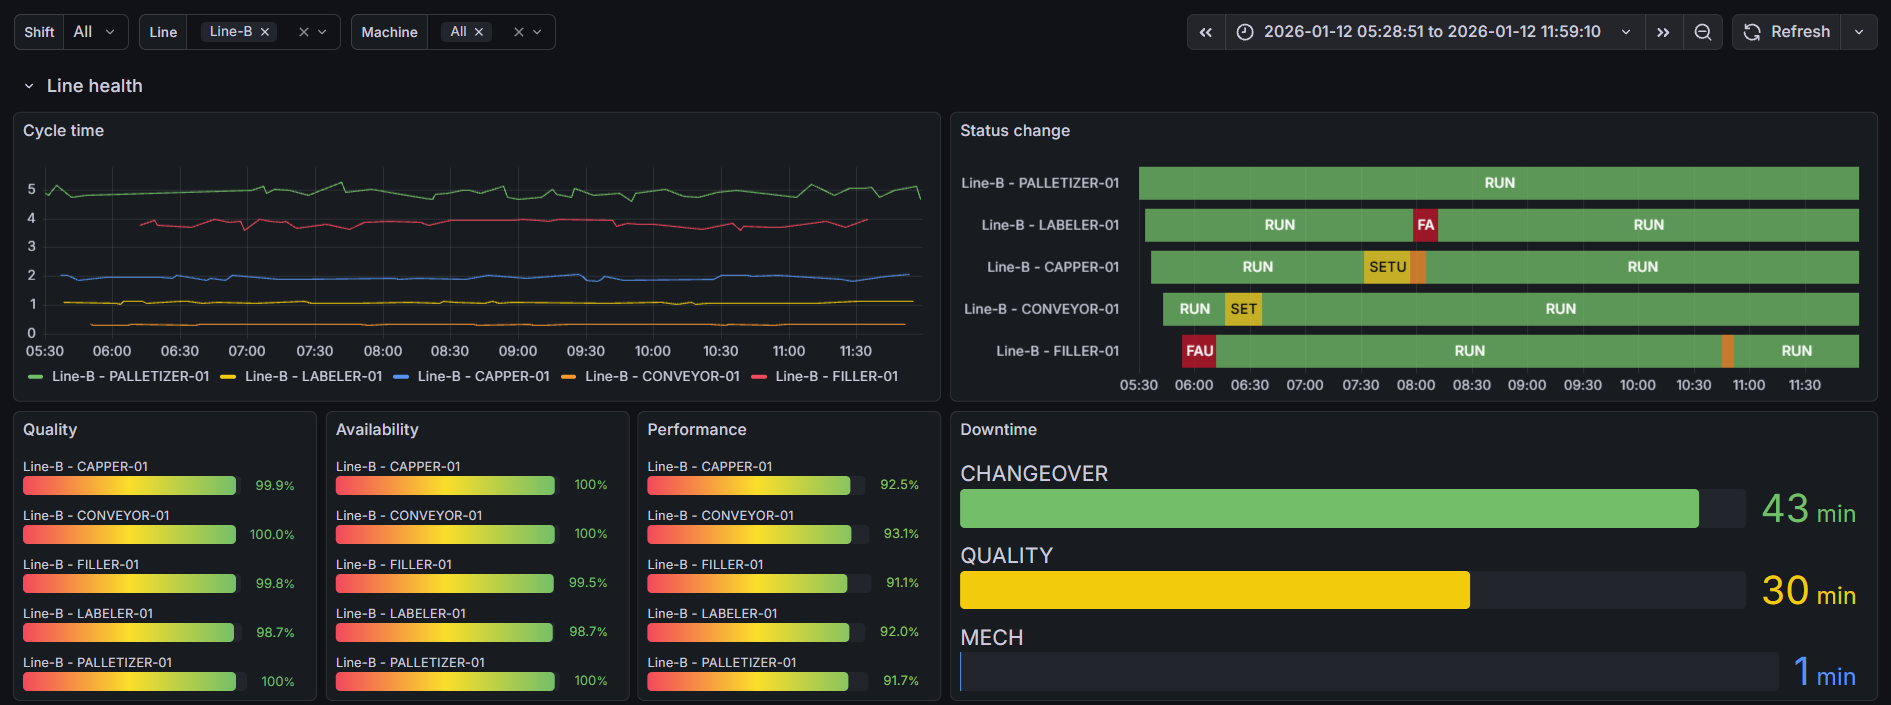
Cycle time, status changes, quality, availability, performance and downtime per machine on a production line.
Dashboard view · 02 / 02
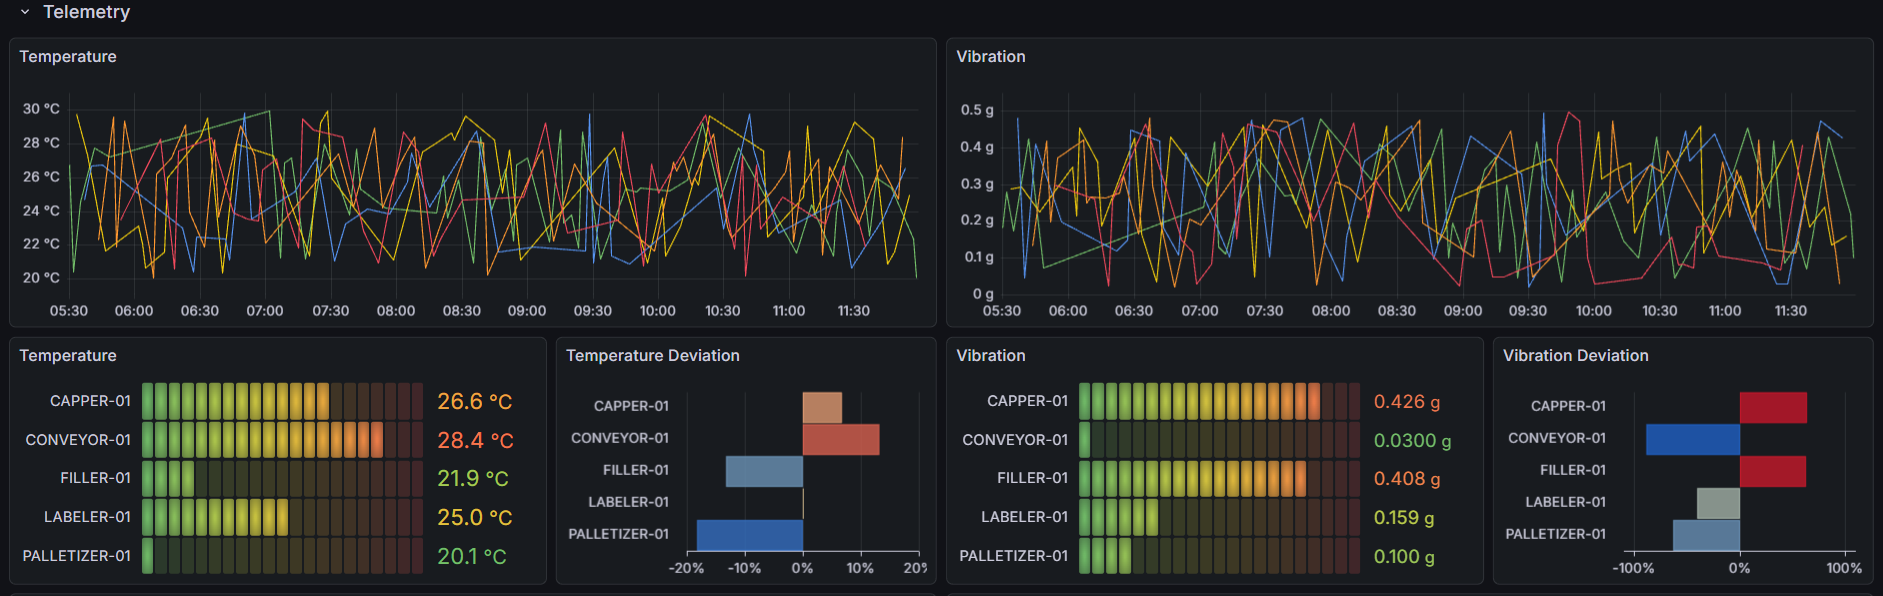
Temperature and vibration over time and per machine, with deviation views.
From industrial control systems to enterprise analytics and AI.
Qualitative project outcomes; no measured performance or cost figures are claimed.
Real-time visibility into OEE, cycle time, and downtime across multiple production lines
Anomaly detection on machine telemetry (temperature, vibration, power) flagging issues before they impact yield
Energy consumption tracked at machine level - enabling targeted reduction initiatives
Structured incident reports replacing ad-hoc downtime tracking
Foundation in place for predictive maintenance use cases
Solution areas: Data Foundations · Data Products

Choose a 30-minute conversation or send us a short enquiry - whichever works for you.